Everything month-end needs, from one upload
Each area works on the same model and the same figures, so the dashboard, the board pack and the answer to your question always agree.
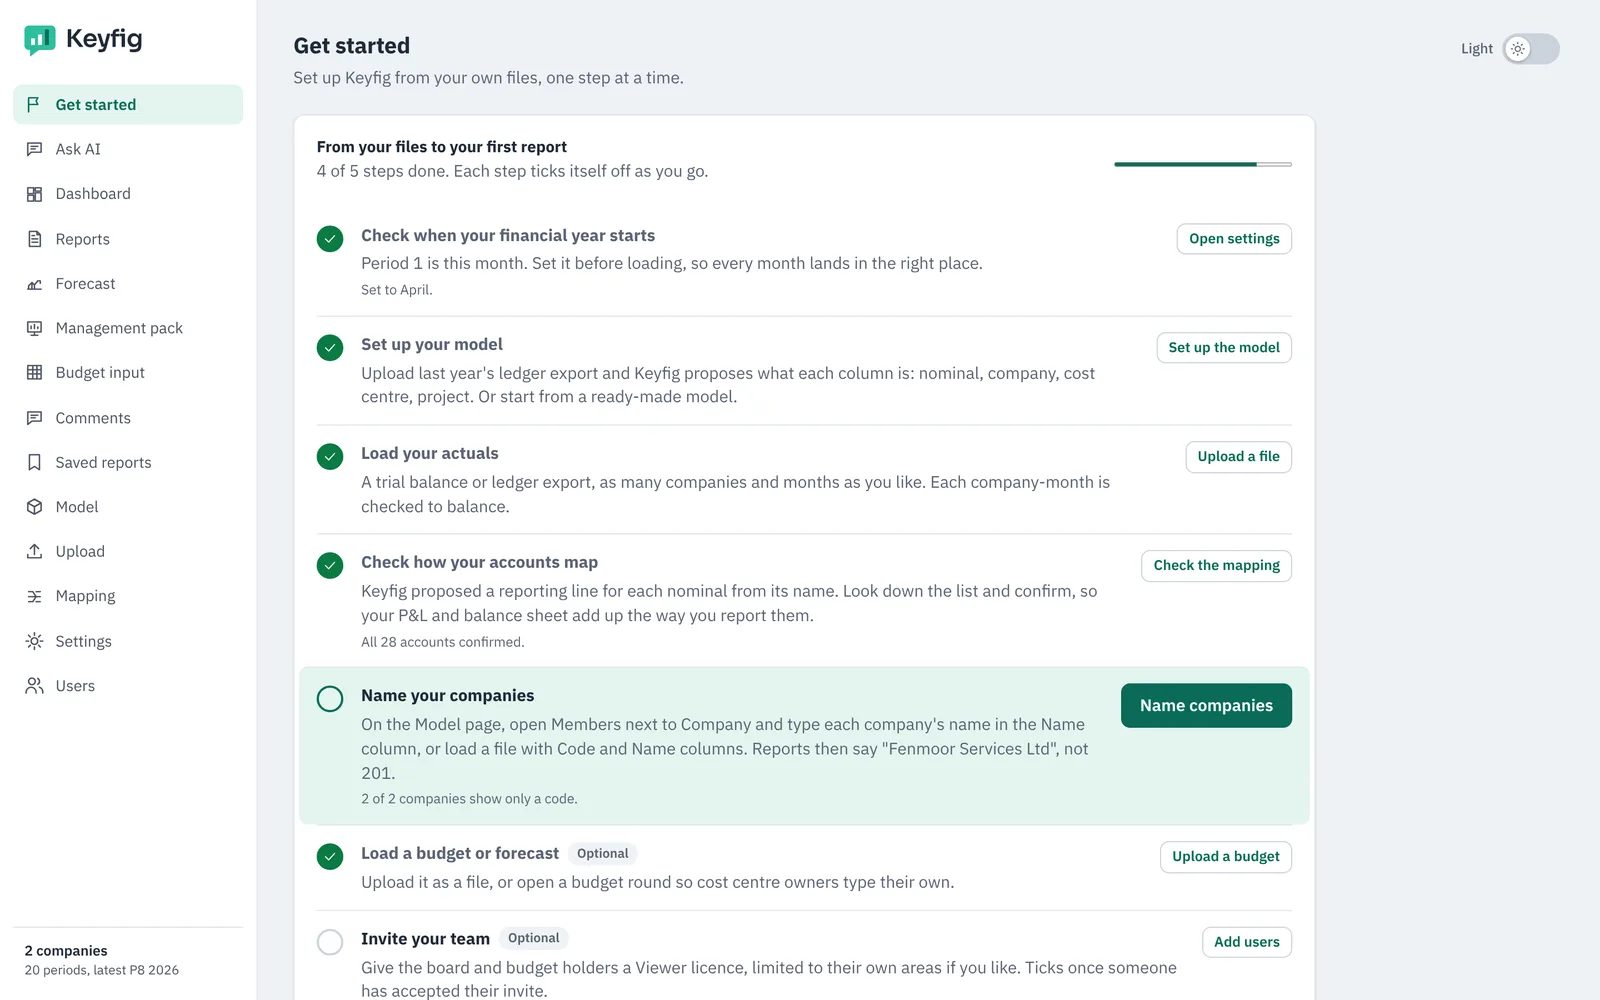
From your files to your first report
Upload last year's ledger export and Keyfig proposes the model: companies, nominals, cost centres, projects and versions. A checklist walks you through the rest.
- Trial balances, GL extracts, budgets and forecasts, from any ledger
- CSV, Excel or tab-separated, many companies and months in one file
- Accounts mapped to P&L and Balance Sheet for you to confirm
- Unbalanced months still load and are flagged, so nothing is hidden
Just ask, don't build
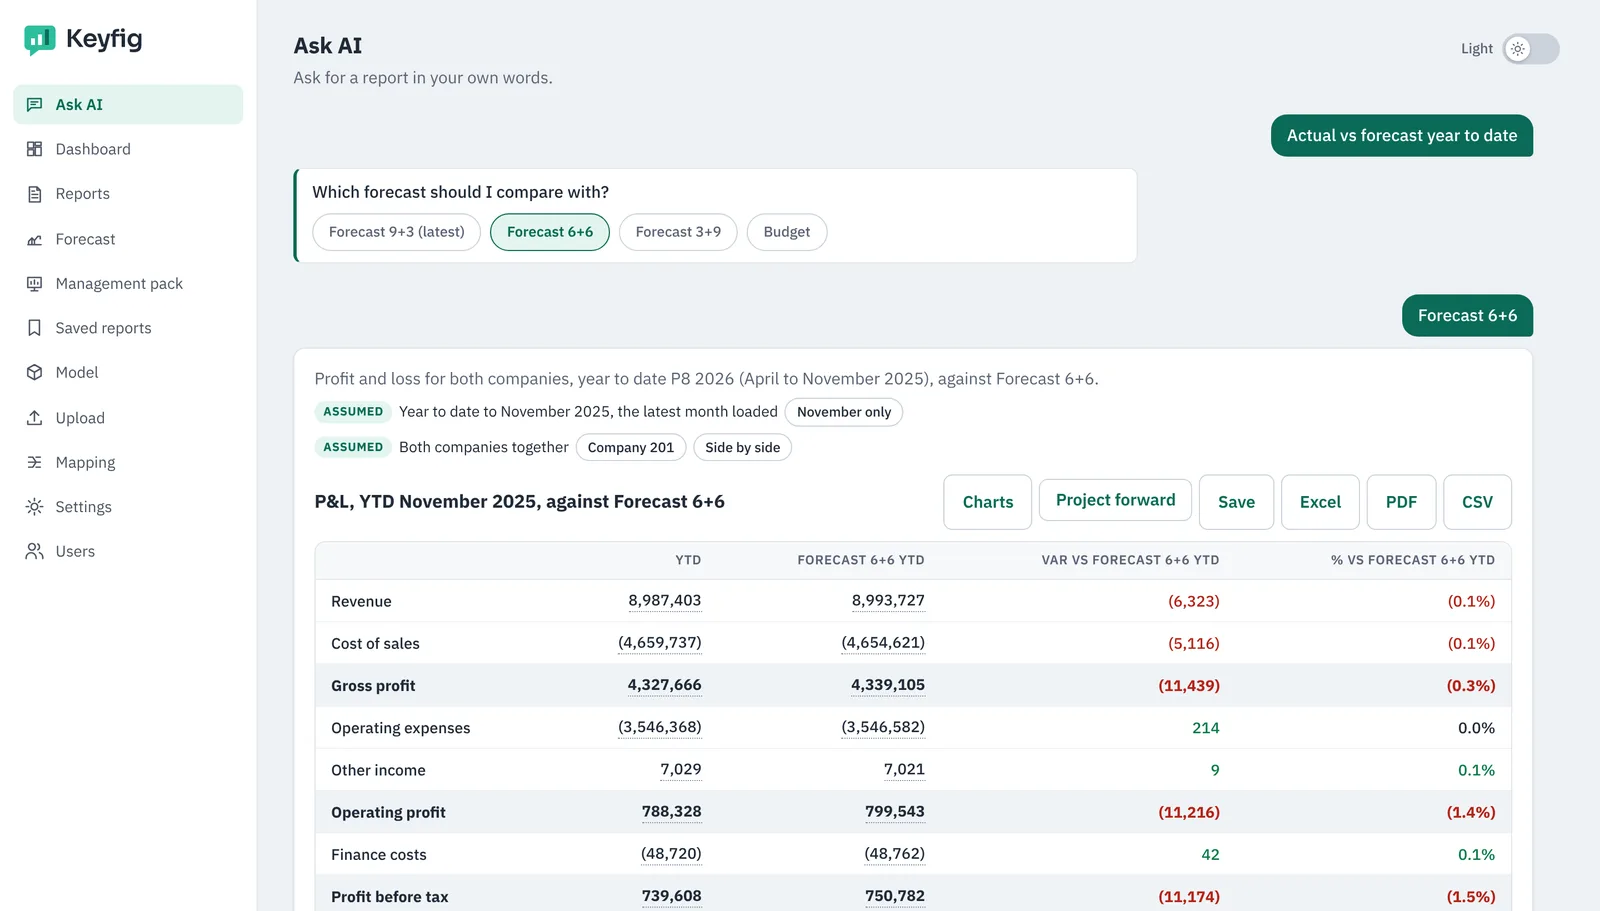
Type the report you want in your own words. Keyfig AI picks the figures from your model, says what it assumed, and gives you one-click alternatives.
- “Actual 2026, company 101, YTD April” or “staff costs against budget by cost centre”
- Asks a quick question when your request could mean two things
- Every figure clicks through to the trial balance lines behind it
- Same question, same data, same answer
Statements and month-by-month grids, ready on upload
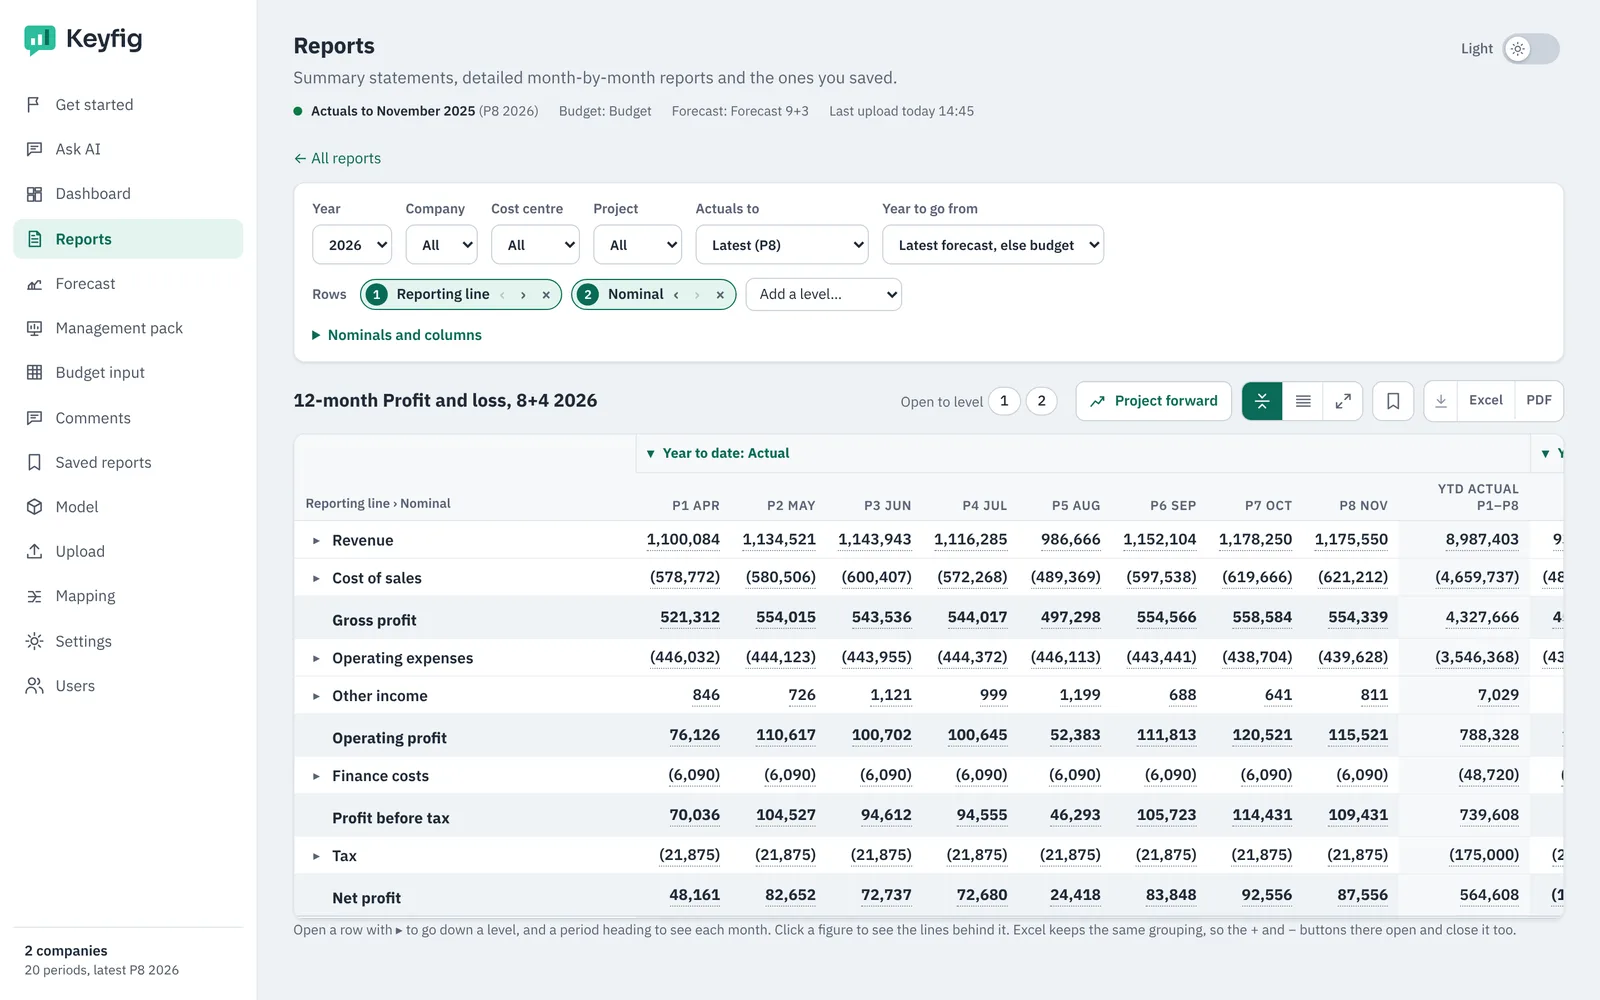
Trial balance, P&L, Balance Sheet and cash flow are built as soon as your data lands. Detailed grids let you pivot by any dimension and drill to the source line.
- Month, quarter, year to date and last 12 months against budget, forecast or last year
- Rows by nominal, cost centre, project or your own dimensions, in any order
- Actuals then forecast for the rest of the year, with the full-year outturn
- Export to Excel with outline levels, or to PDF
Month-end at a glance
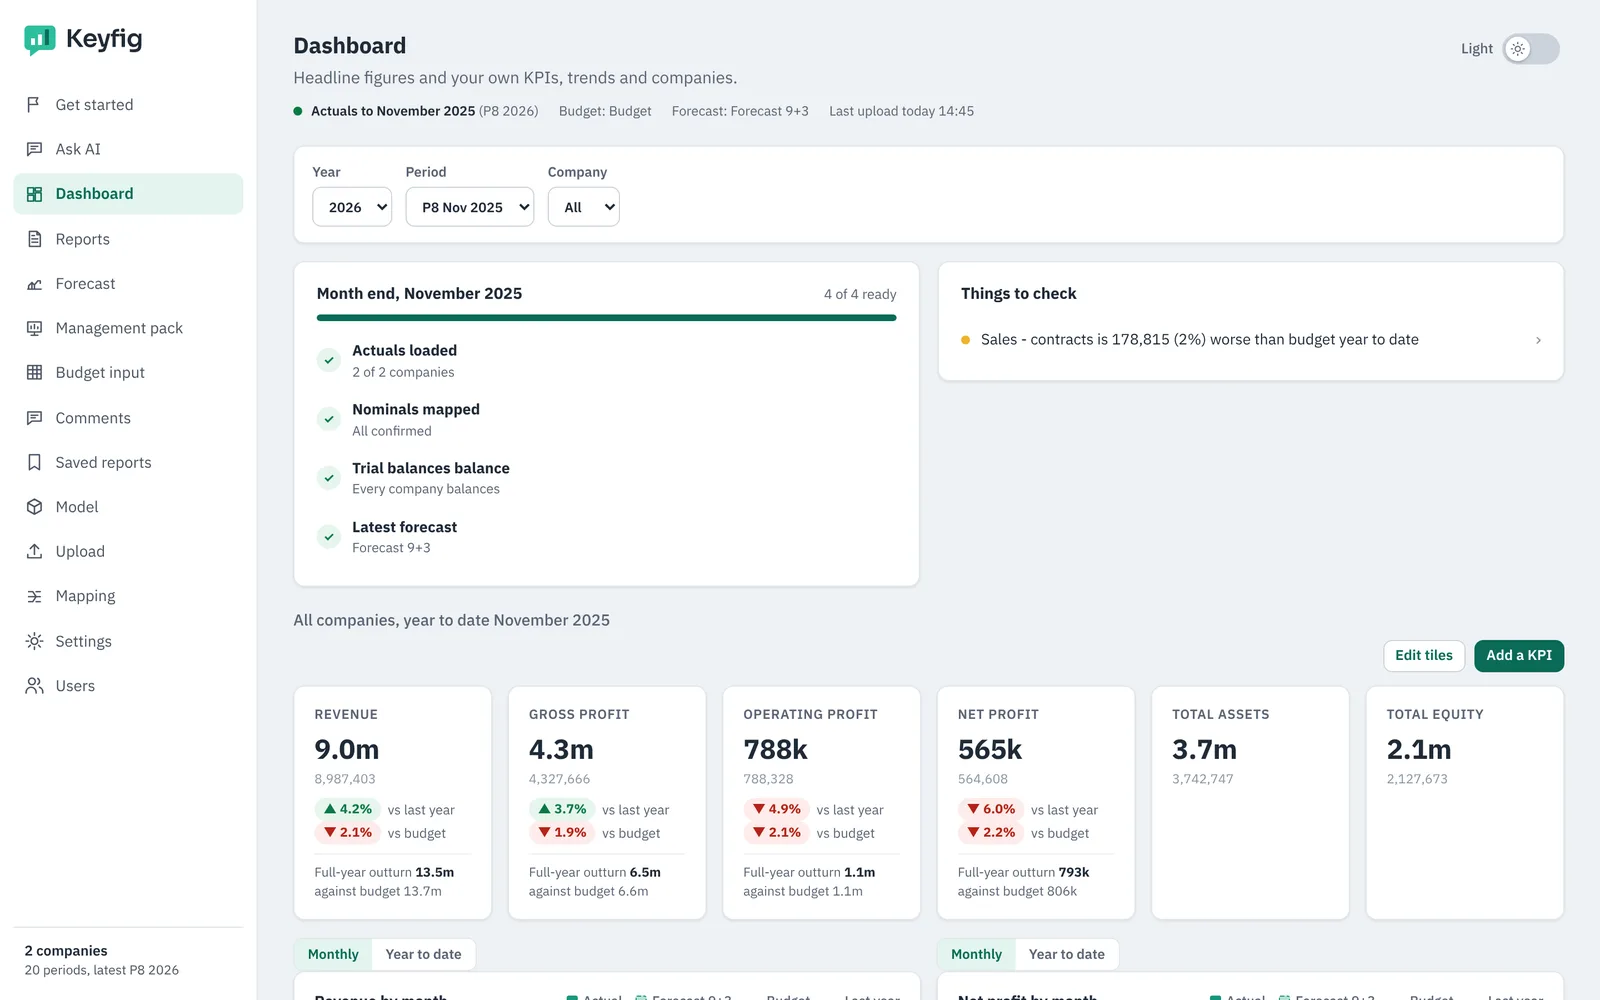
Headline figures with change on last year and budget, the month-end checklist, and the things worth a closer look. Add your own KPIs by describing them.
- Revenue, margins and profit by month, with budget and forecast lines
- Working capital and covenant KPIs: debtor days, net debt to EBITDA, interest cover
- “Staff costs as a % of revenue” becomes a KPI tile
- Things to check: the biggest moves against budget, flagged for you
Forecasts from a few assumptions
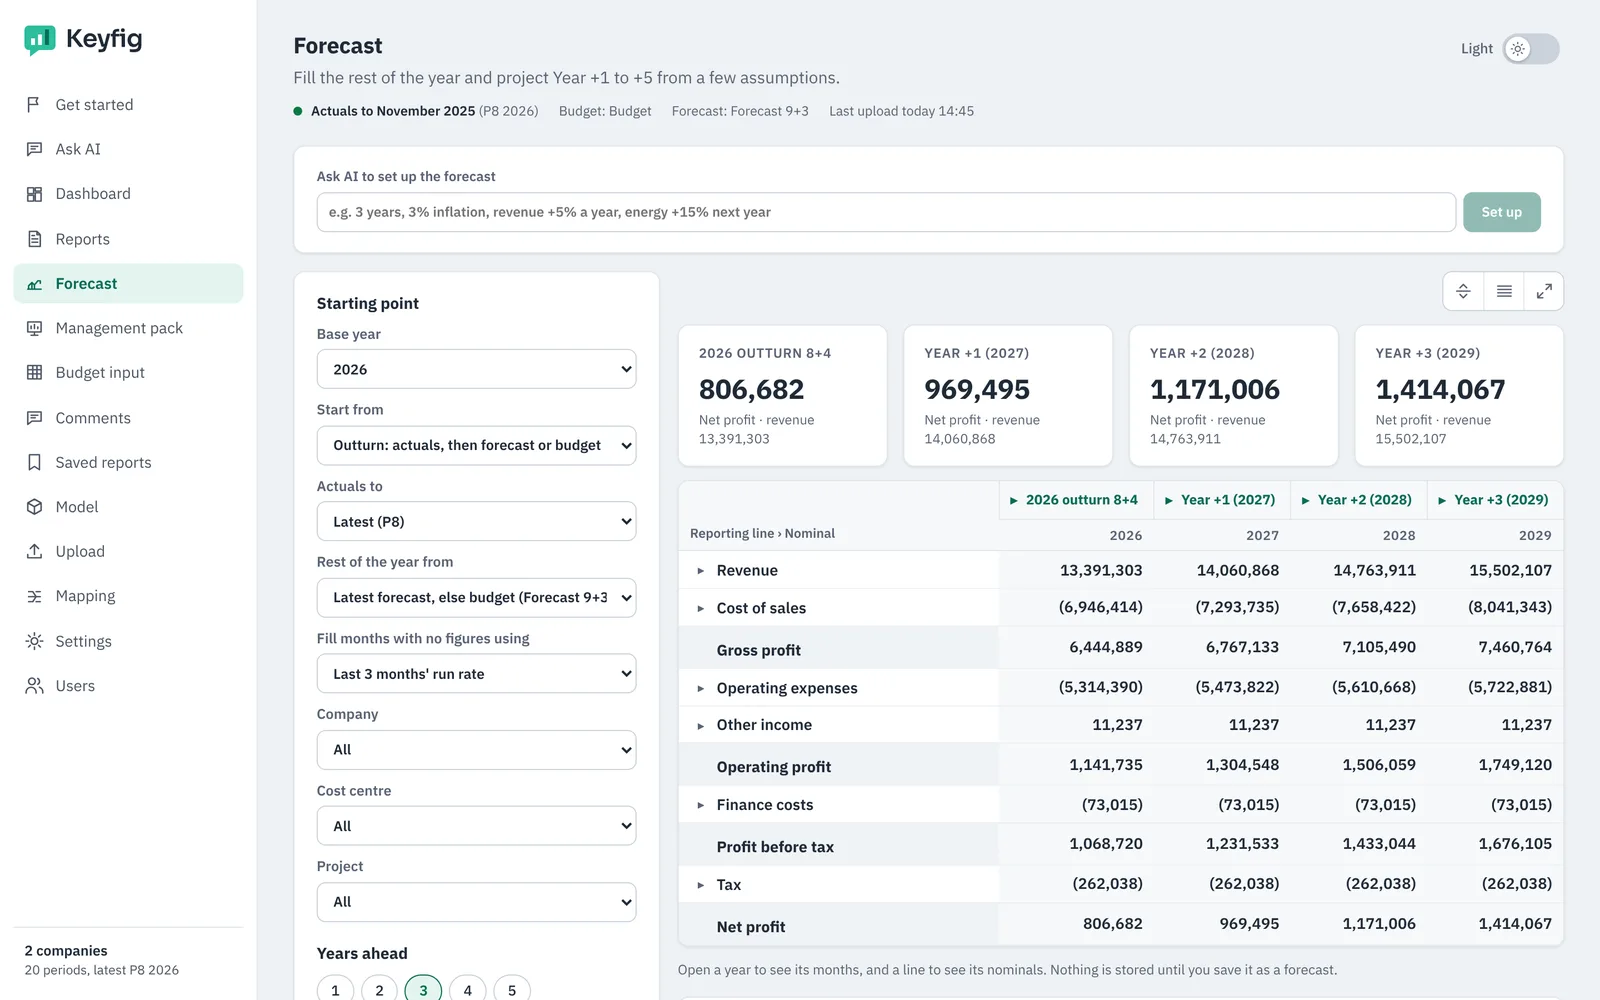
Fill the rest of the year and project up to five years ahead with simple rules, then save it as a forecast version that every report can use.
- Fill gaps from run rate, last year or budget
- Inflation, growth and percentage-of-revenue rules by line
- Named adjustments you can explain to the board
- Or describe it: “3 years, 3% inflation, revenue +5% a year”
Budget rounds without the spreadsheet chase
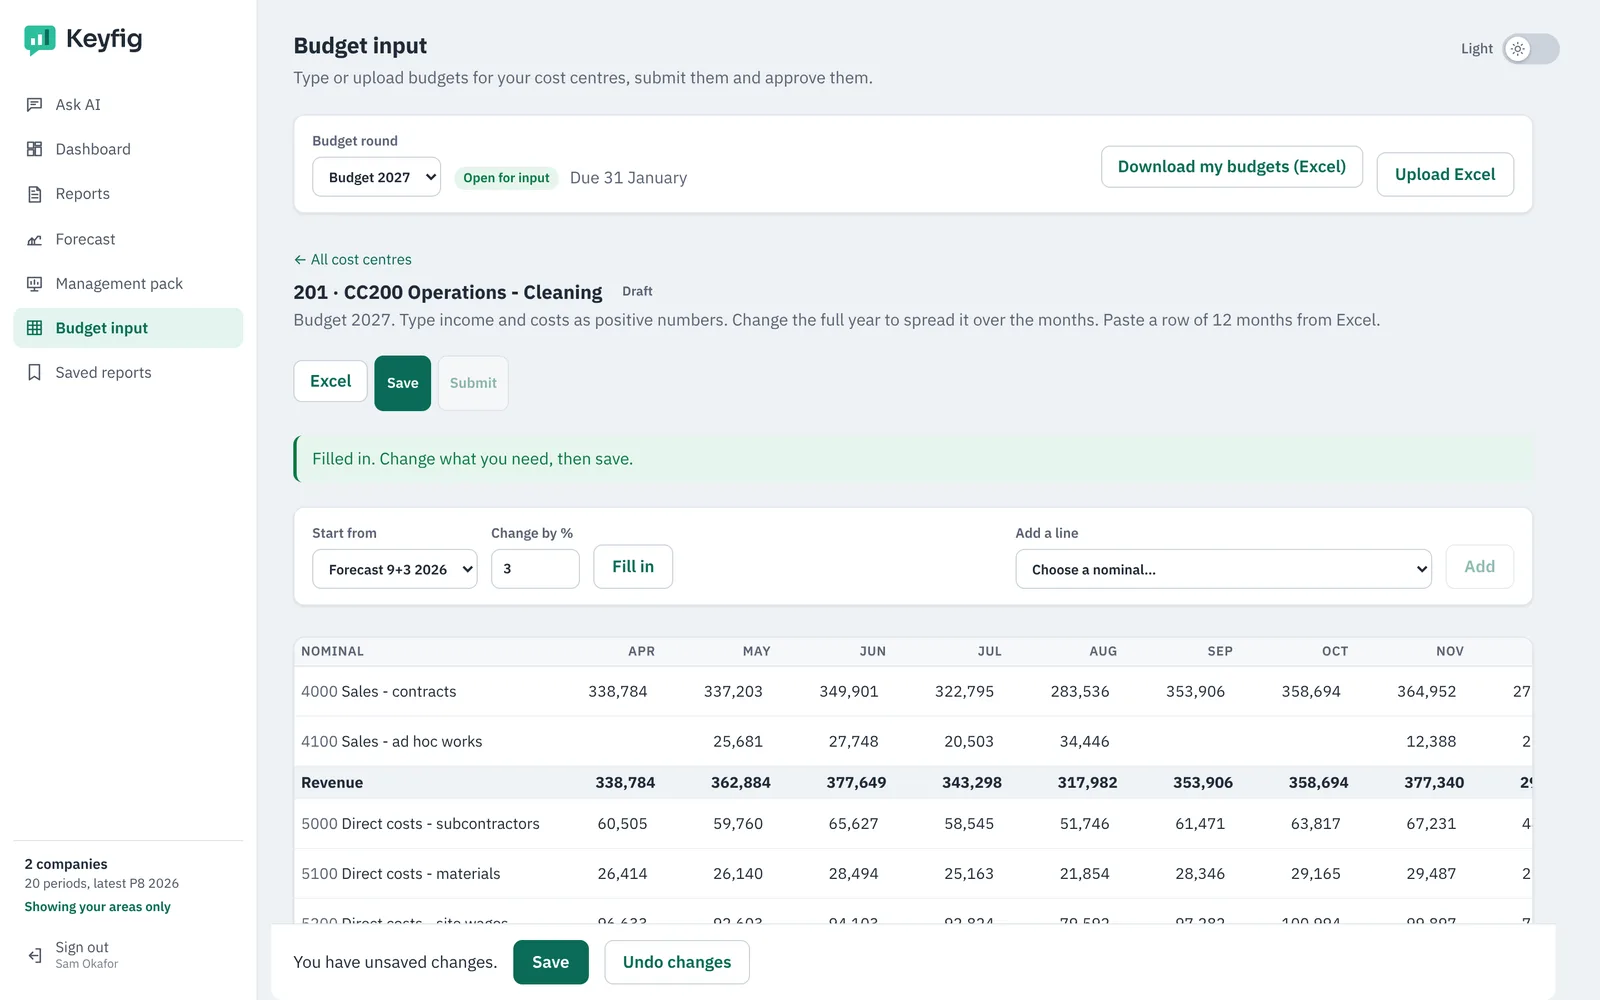
Budget holders type or upload the budget for their own cost centres. You open the round, review, approve or send back with a note.
- Web grid, or an Excel round trip in the same layout
- Start from an existing budget or forecast, or from scratch
- Submit, approve and return, with comments on any cell
- Balance sheet and cash drivers for a full three-statement budget
A board pack with commentary, in minutes
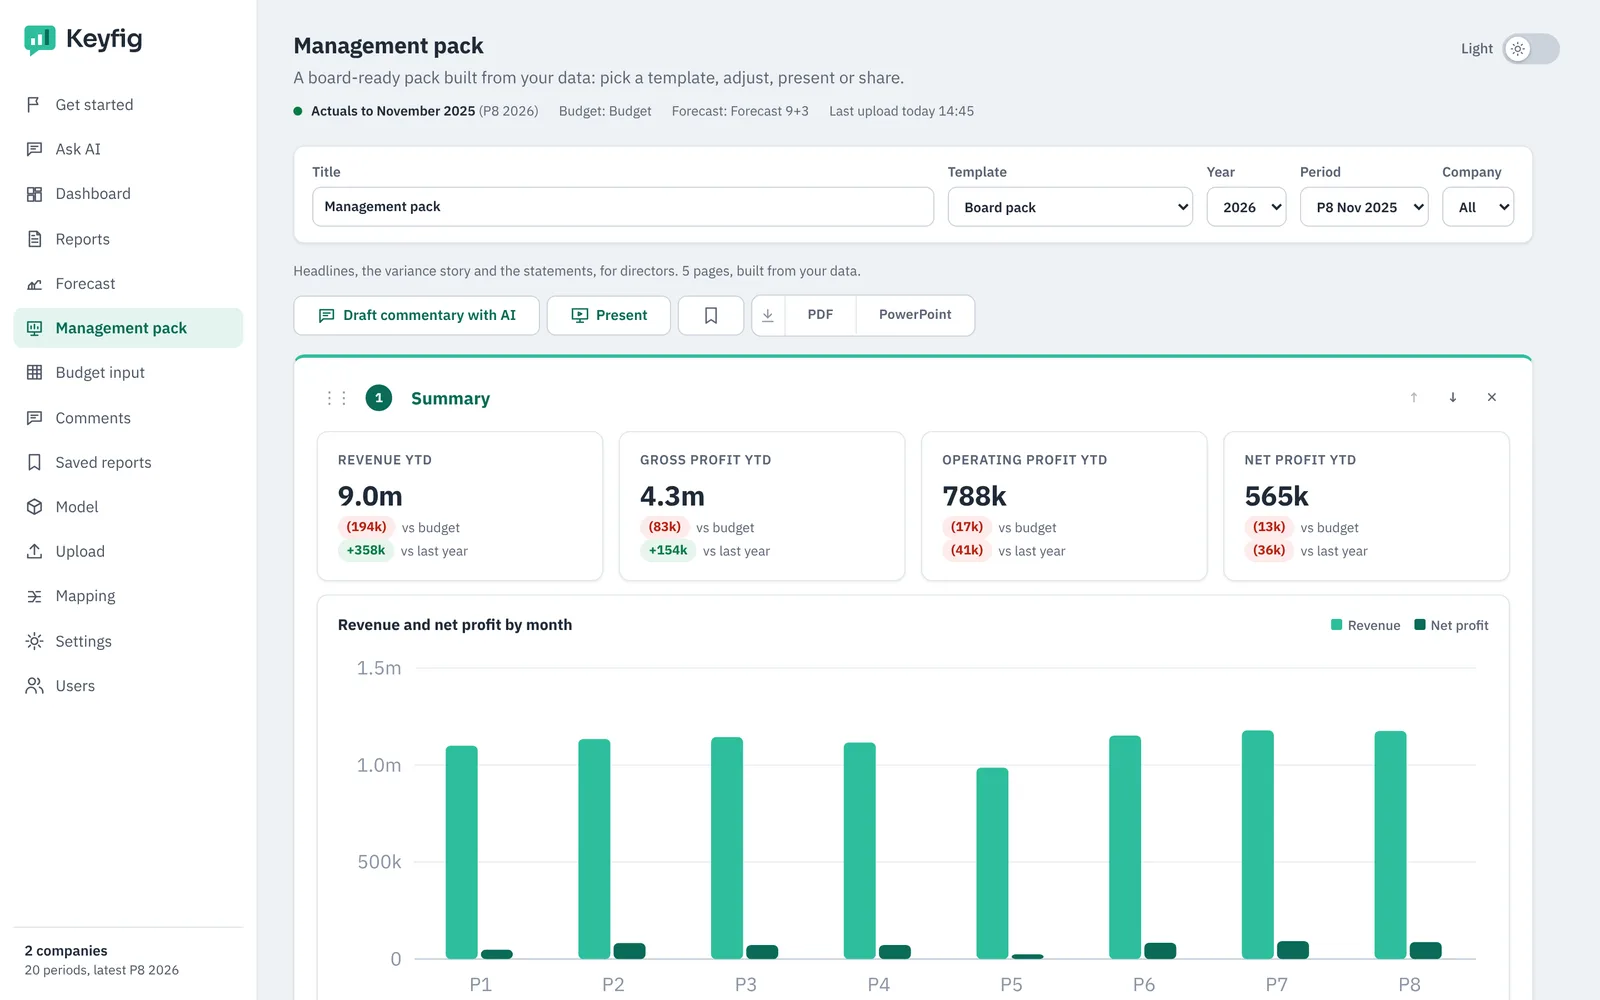
Pick a template and Keyfig builds the pages from your data. Keyfig AI drafts the commentary for you to edit, then present, share or export.
- Summary, trends, variances and statements
- AI commentary you edit before anyone sees it
- Present in the browser, share a link, or export to PDF and PowerPoint
- Your own logo and colours
The right figures for each person
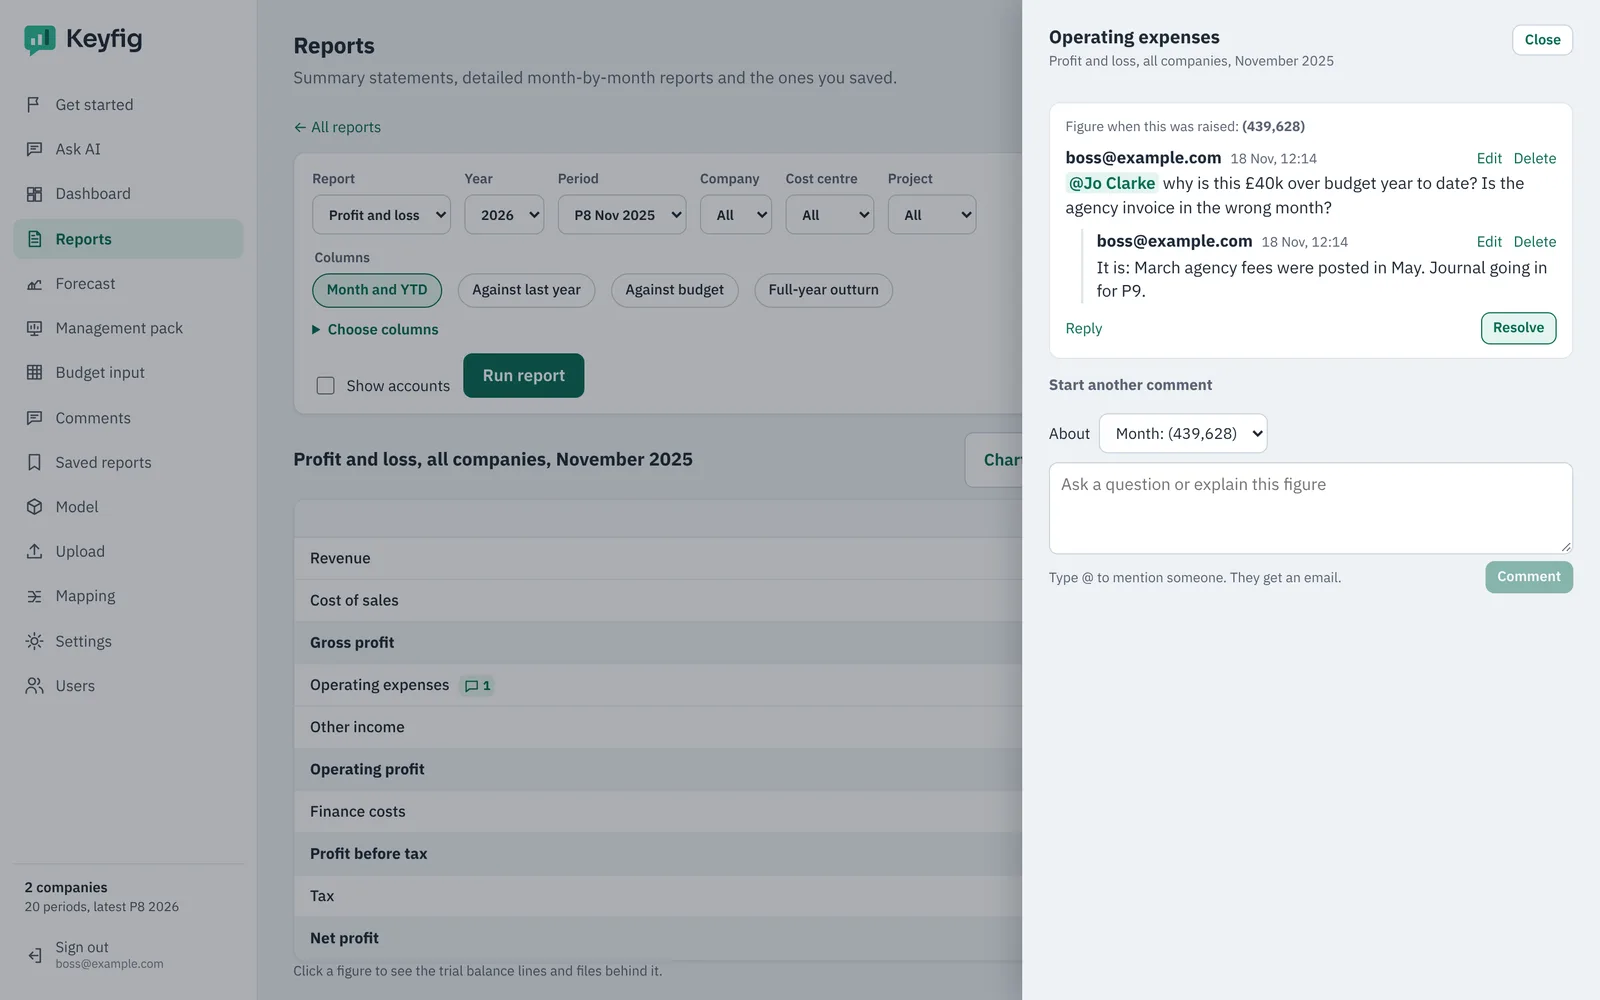
Invite colleagues as Pro or Viewer users and decide which companies, cost centres or projects each one sees. Questions about a figure stay with the figure.
- Comments and @mentions on any report line, grid row or pack page
- Data access by user: a budget holder sees only their own area
- Sign in with Microsoft or Google, with two-step sign-in
- An activity log of uploads and changes
See your own numbers in Keyfig
Bring a trial balance export from your ledger. In a 30-minute call we load it, build your reports and answer your questions live.